Amidst the vast metrics available, key performance indicators for eCommerce stand out as the compass guiding businesses to optimal growth and profitability. While many metrics capture glimpses of online performance, understanding the fundamental eCommerce KPIs offers a holistic view, ensuring eCommerce strategies that not only resonate with customers but also bolster the bottom line.
This article delves deep into the six pivotal KPIs every online retailer should be monitoring, providing actionable insights and shedding light on the intricate dance of numbers behind a thriving online store.
The Crucial Role of eCommerce Performance Indicators
In an environment as dynamic as online retail, every decision can either propel a business forward or set it back. eCommerce performance indicators serve as the foundational pillars, offering real-time feedback on a store’s health and its resonance with customers.
Beyond just diagnostics, these metrics become the heartbeat of successful marketing strategies, enabling businesses to optimize their eCommerce campaigns.
By keeping a pulse on these indicators, retailers can make insightful decisions that cater to real-time consumer behavior, preferences, and market trends. Without a keen eye on these indicators, businesses risk navigating the vast digital marketplace blindfolded.
Conversely, with diligent monitoring, they’re equipped to harness data, refine campaigns, and carve a pathway to sustainable success.
10 eCommerce KPIs to follow closely
Product Views
Product Views refer to the number of times a particular product page has been viewed by online shoppers.
Product Views serve as an initial indicator of customer interest and the appeal of your product listings. A high number of views suggests that a product is grabbing attention, either due to its image, title, or position in search results. However, if these views aren’t translating into sales, you should question the factors causing this disconnect.
You can set up these events to be tracked in Meta’s event manager if you’re running your ads on Facebook.
Add to Cart Rate
The Add to Cart Rate is a metric that quantifies the percentage of website visitors who add a product to their cart, regardless of whether they finalize the purchase. It’s a measure of initial interest and intent. A robust Add to Cart Rate is a testament to both the appeal of your products and the usability of your website. If users are frequently adding items, it suggests that product listings, images, and descriptions resonate with your audience.
Moreover, a smooth and intuitive browsing experience can further boost this rate. Conversely, a low Add to Cart Rate may indicate areas for improvement in product presentation or website navigation.
This gives valuable insights into initial user engagement and areas for potential optimization.
Cart Abandonment Rate
Cart abandonment rate refers to the percentage of online shoppers who add items to their shopping cart but then leave without completing the purchase. It’s calculated using the formula:
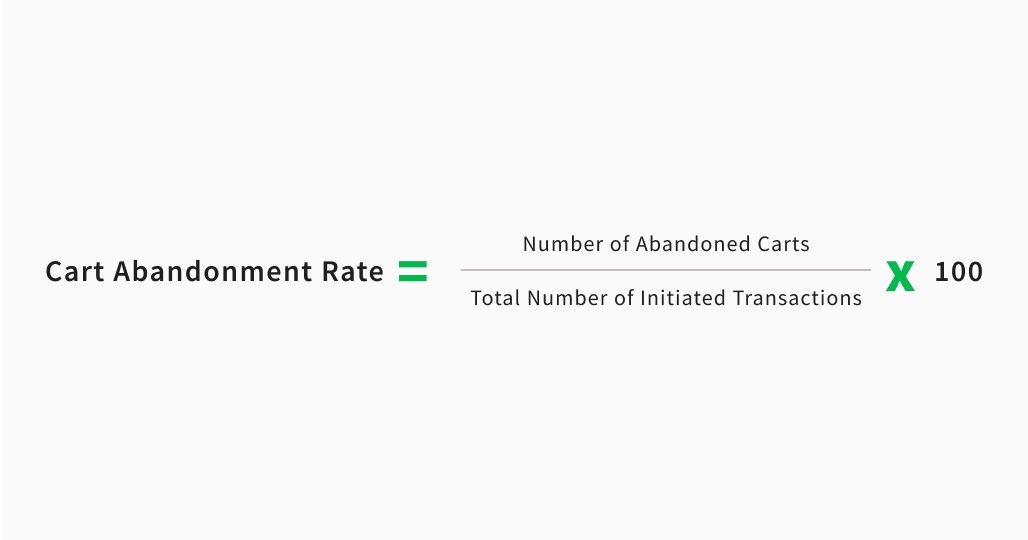
A high Cart Abandonment Rate can serve as a glaring red flag for eCommerce businesses. It indicates that while visitors are interested enough to select products, something is deterring them from finalizing the transaction.
This not only signifies lost sales but also potential issues in the shopping experience. It might be related to unexpected shipping costs, a complex checkout process, concerns about payment security, or even website performance issues.
The reasons may differ, thus it is important to closely investigate to know the reason behind your high cart abandonment.
Tip: To reduce your cart abandonment rate, you can remarket this audience to remind them that they left/forgot products in their cart, and incite them to finish checkout by offering them a discount.
Checkout Abandonment Rate
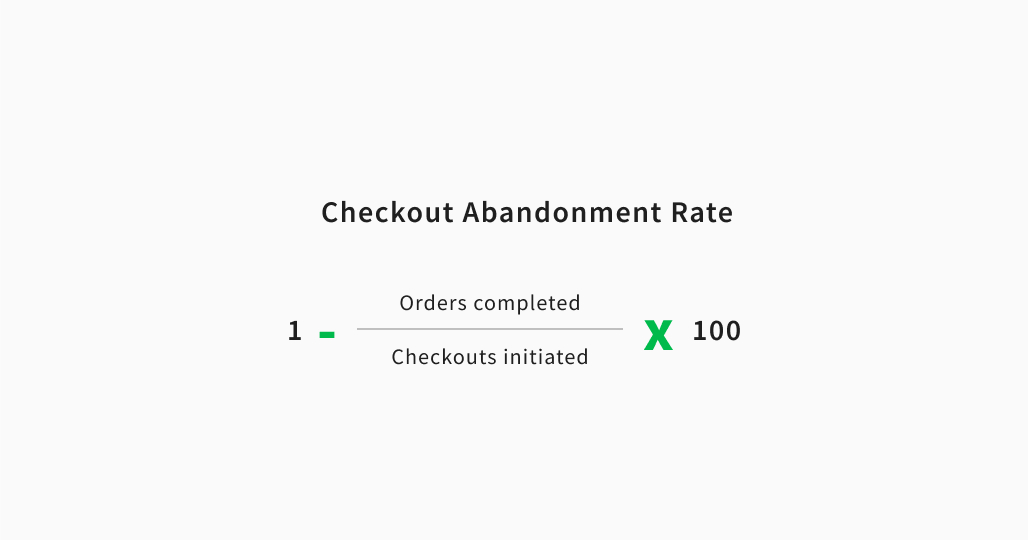
While the cart abandonment rate focuses on users who add items to their carts but leave without making a purchase, the Checkout Abandonment Rate is more specific.
It measures the percentage of shoppers who begin the checkout process but then exit before completing the transaction. This metric hones in on the final stages of the buying process, typically after a user has proceeded past the cart page.
Monitoring the Checkout abandonment rate is crucial because it can pinpoint friction points in the last, critical steps of the sales funnel.
Conversion rate
The conversion rate is a fundamental metric in eCommerce that measures the percentage of visitors to your online store who take a desired action, such as making a purchase. It’s calculated by dividing the number of successful conversions (e.g., purchases) by the total number of visitors, then multiplying by 100 to get a percentage. For example, if 100 people visit your site and 5 of them make a purchase, your conversion rate is 5%.
The conversion rate is often regarded as one of the paramount KPIs for eCommerce. Why? Because it provides a clear snapshot of how effectively your traffic is converting.
How to improve conversion rate in eCommerce ?
A/B Testing
Regularly test different versions of product pages, landing pages, or call-to-action buttons to determine which resonates most with your audience.
Optimizing Product Pages
Ensure high-quality images, clear and compelling product descriptions, and easy navigation. A seamless user experience can significantly improve the chances of conversion.
Improving Site Speed
If you have a transactional website, a slow loading can deter your potential customers. Utilize tools like Google PageSpeed Insights to identify areas for speed optimization and enhance the overall user experience.
Revenue
Understanding and monitoring your revenue is paramount and is the lifeblood of the business. In fact, for any eCommerce business, revenue serves as a direct indicator of overall performance and market traction.
A consistent increase in revenue signals that your strategies are resonating with your audience, while a decline indicates areas that require attention and optimization. Simply put, if you’re not closely tracking revenue, you’re missing out on vital insights that can shape your business decisions.
then it’s high time to take a closer look at your revenue streams. Prioritizing revenue as a key performance indicator ensures you stay grounded in the tangible outcomes of your efforts and can adjust strategies in real-time based on concrete data.
ROAS (Return on Ad Spend)
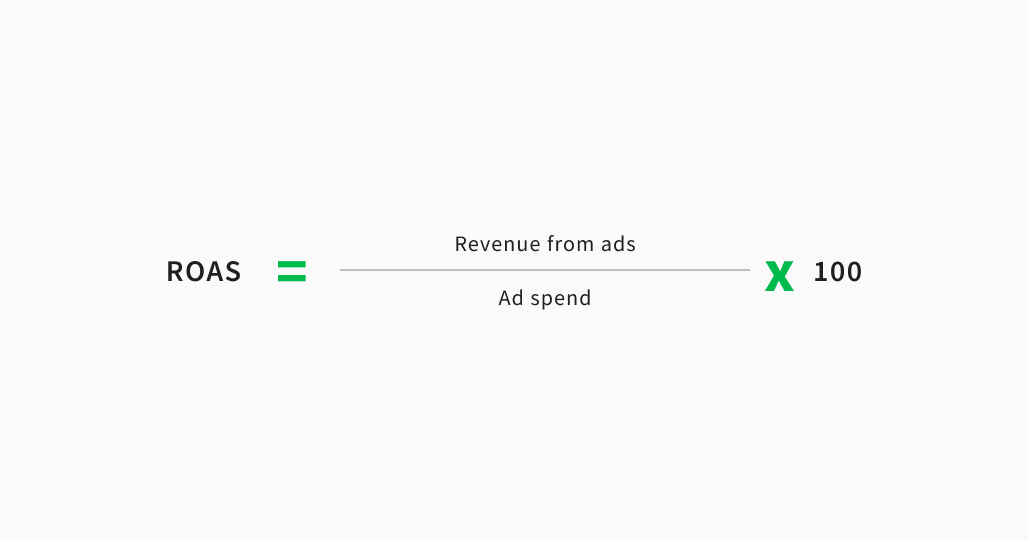
ROAS, or Return on Ad Spend, is a metric that calculates the revenue generated for every dollar spent on advertising. It’s determined by dividing the revenue from ad-driven sales by the total amount spent on those advertisements.
Unlike other metrics that might measure broader aspects of business health or efficiency, ROAS is laser-focused on the direct profitability of advertising campaigns.
The significance of ROAS in the eCommerce landscape cannot be overstated. In an era where advertising budgets can quickly escalate, ensuring that every dollar invested in campaigns brings a positive return is crucial.
A high ROAS indicates that your advertising efforts are effectively reaching and resonating with your target audience, resulting in profitable sales.
Conversely, a lower ROAS suggests potential inefficiencies in advertising strategies, audience targeting, or ad content.
Essential Amazon Advertising KPIs
ACOS
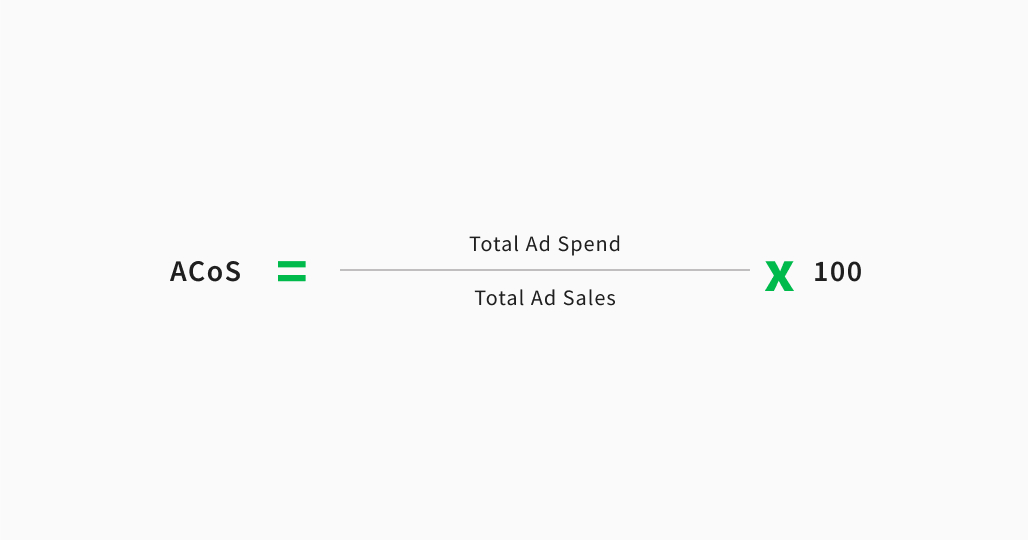
ACOS, or Advertising Cost of Sales, is a vital KPI for sellers advertising on Amazon. This KPI measures the effectiveness of your Amazon advertising campaign. Specifically, it’s calculated by dividing the total ad spend by the sales generated from the ads, then multiplying by 100. For instance, if you spent $50 on advertising and made $250 in sales from those ads, your ACOS would be 20%.
This eCommerce KPI offers sellers a clear insight into the efficiency and profitability of their Amazon advertising campaigns. A lower ACOS indicates that you’re getting a good return on your ad spend, while a higher ACOS might suggest that your advertising strategy needs optimizations.
TACOS – Total Advertising Cost of Sales
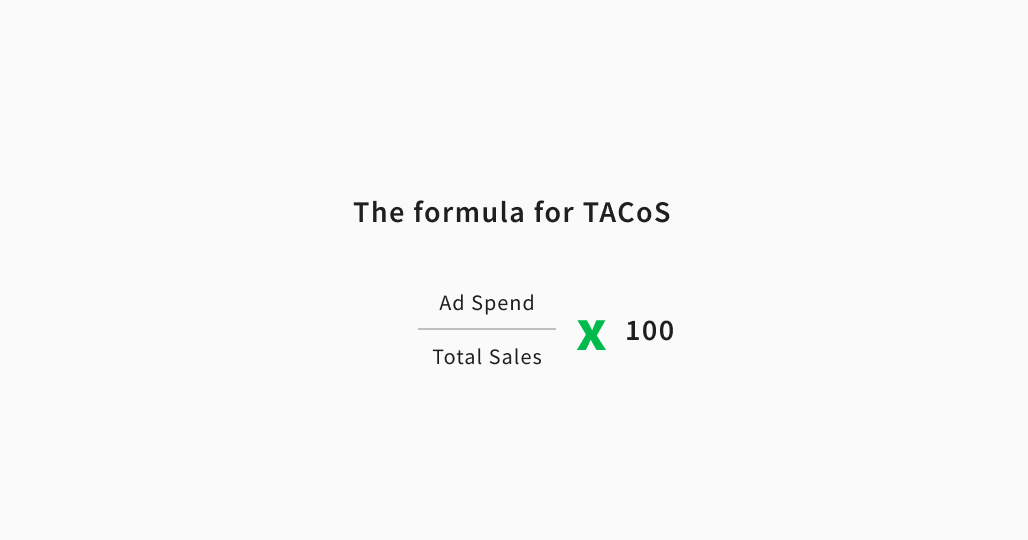
TACOS offers a broader perspective on how advertising affects overall business health. It factors in both organic and ad-driven sales, giving sellers a more comprehensive understanding of their advertising’s true impact on total revenue.
In fact, a rising TACOS might indicate that a significant portion of total sales is increasingly reliant on paid advertising, which could be a concern if organic sales are lagging.
On the other hand, a decreasing TACOS suggests growing organic sales and potentially improved overall brand recognition.
Ready to master your eCommerce KPIs?
Navigating the intricate world of online retail can be daunting, but armed with the right eCommerce KPIs, you have the power to turn insights into action.
Improve your eCommerce performance now